Ohio Drought Events - Ohio Drought Monitoring
Home About Research Team


Overview of Ohio Drought Through the Years

Ohio PDSI Graph for 1895-2021
Monthly Palmer Drought Severity Index (PDSI) for Ohio for 1895-2021. PDSI is one measure of drought that
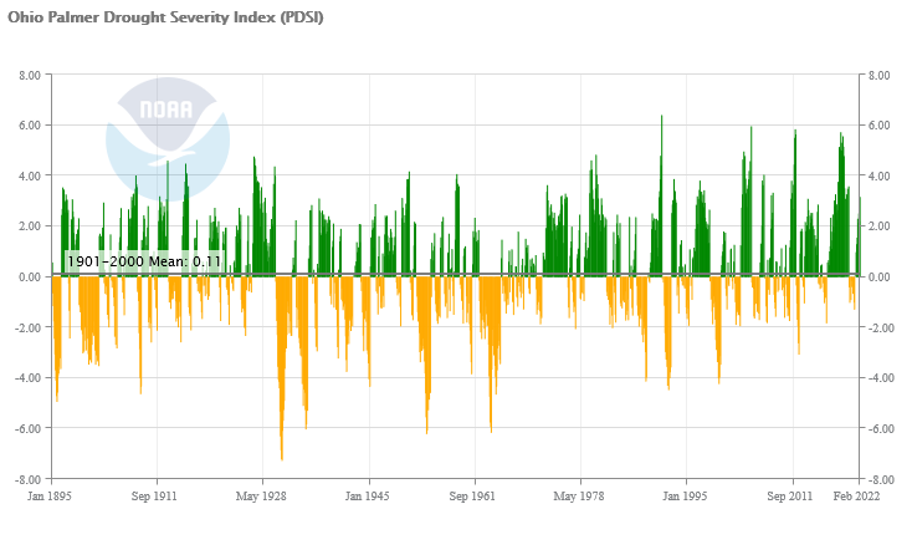
uses temperature and precipitation to estimate relative dryness. The scale spans from -10 (dry; yellow) to +10 (wet; green)


Historically, Ohio has experienced periods of low precipitation that lasts 2-5 years with prolonged clusters
of drought occurring between 1930 and 1966 (Rogers 1993). Over the last 40 years, droughts have been comparatively shorter in length and of lesser
magnitude than earlier in the record.
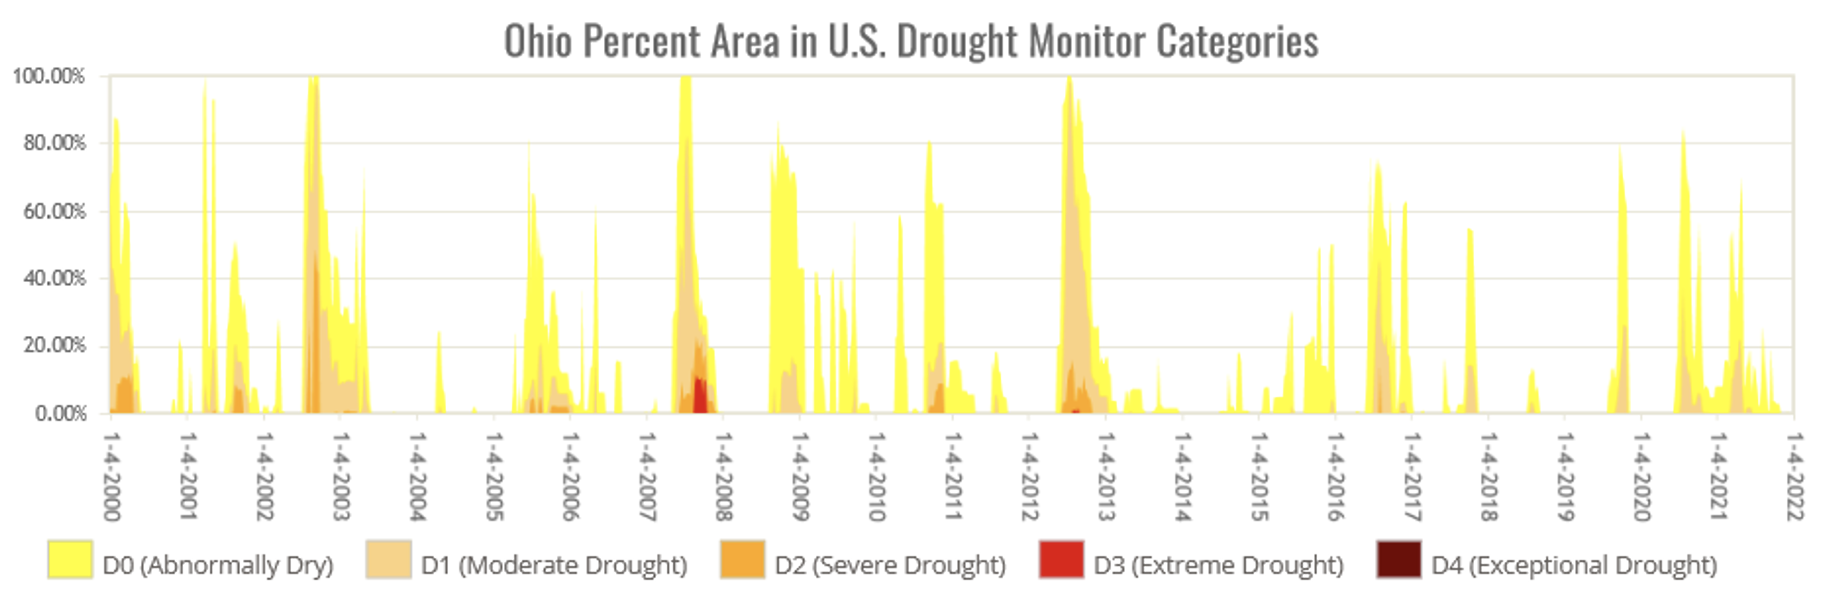


US Drought Monitor

A joint product called the US Drought Monitor (USDM), produced by the National Drought Mitigation Center (NDMC) at the University of Nebraska-Lincoln, the National Oceanic and Atmospheric Administration (NOAA), and the U.S. Department of Agriculture (USDA), has been in operation since 1999. The USDM leverages local experts to help synthesize the best available data for a weekly update to drought conditions around the county. The USDM uses five classifications: abnormally dry (D0), showing areas that may be going into or are coming out of drought, and four levels of drought: moderate (D1), severe (D2), extreme (D3) and exceptional (D4). Using the time series of Ohio percent area in USDM Categories, recent droughts in Ohio include: 2002-2003, 2007-2008, 2012-2013, and 2016-2017. For a summary of these recent droughts, select the drought of interest from the dropdown menu above.
Ohio's USDM levels since 2000
Wildfire Count by County, 2004-2015
Ohio wildfires by county, 2004-2015


OSU Logo NDMC Logo NIDIS Logo NOAA Logo Unidata Logo USDA Logo USGS Logo
Questions and Comments? quiring.10@osu.edu